1
2
3
4
5
6
7
8
9
10
11
12
13
14
15
16
17
18
19
20
21
22
23
24
25
26
27
28
29
30
31
32
33
34
35
36
37
38
39
40
41
42
43
| import tensorflow as tf
import numpy as np
import matplotlib.pyplot as plt
x_data = np.linspace(-0.5,0.5,200)[:,np.newaxis]
noise = np.random.normal(0,0.02,x_data.shape)
y_data = np.square(x_data) + noise
x = tf.placeholder(tf.float32,[None,1])
y = tf.placeholder(tf.float32,[None,1])
Weights_L1 = tf.Variable(tf.random_normal([1,10]))
biases_L1 = tf.Variable(tf.zeros([1,10]))
Wx_plus_b_L1 = tf.matmul(x,Weights_L1) + biases_L1
L1 = tf.nn.tanh(Wx_plus_b_L1)
Weights_L2 = tf.Variable(tf.random_normal([10,1]))
biases_L2 = tf.Variable(tf.zeros([1,1]))
Wx_plus_b_L2 = tf.matmul(L1,Weights_L2) + biases_L2
prediction = tf.nn.tanh(Wx_plus_b_L2)
loss = tf.reduce_mean(tf.square(y-prediction))
train_step = tf.train.ProximalGradientDescentOptimizer(0.1).minimize(loss)
with tf.Session() as sess:
sess.run(tf.global_variables_initializer())
for _ in range(2000):
sess.run(train_step,feed_dict={x:x_data,y:y_data})
prediction_value = sess.run(prediction,feed_dict={x:x_data})
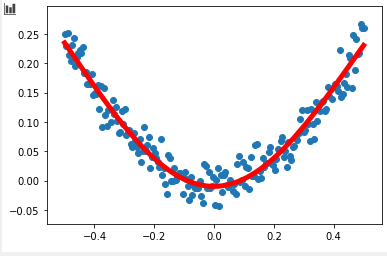
plt.figure()
plt.scatter(x_data,y_data)
plt.plot(x_data,prediction_value,'r-',lw=5)
plt.show()
|

